What it shows
Three pages, plus a detail page per request.
Requests
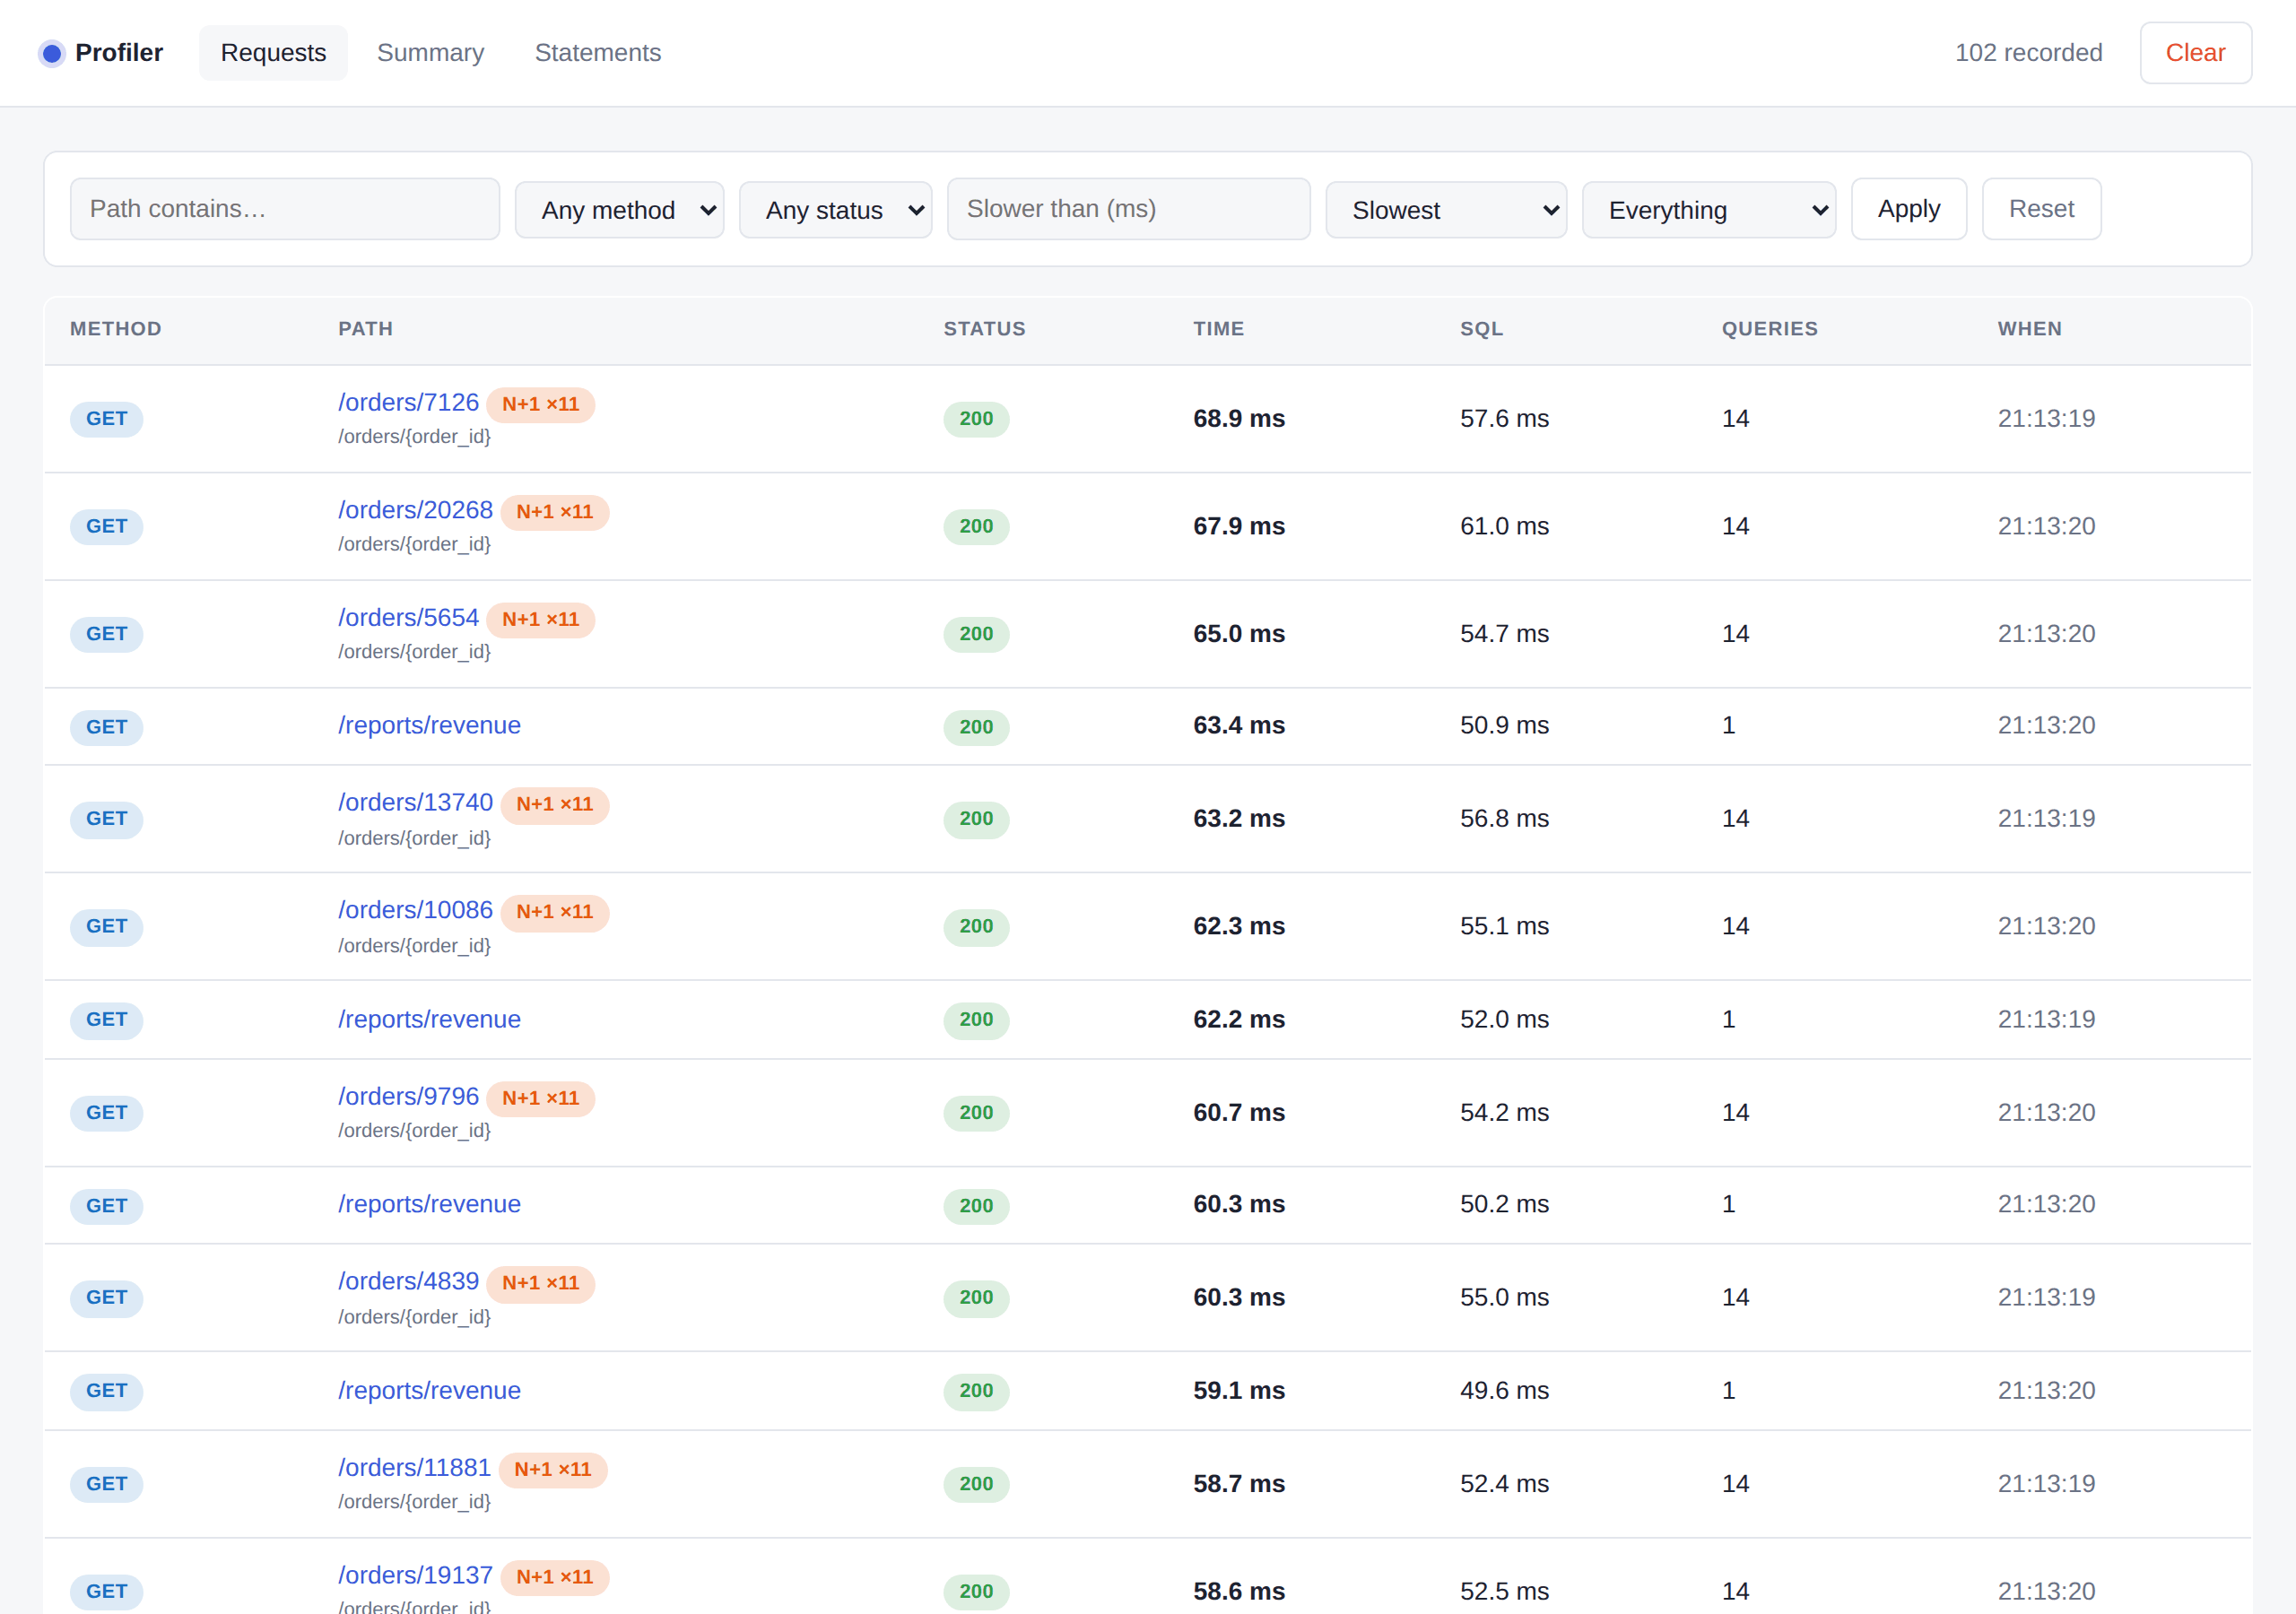
Every recorded request, newest first by default. Filter by path, method, status or duration; sort by slowest, most queries or most SQL time; or narrow to just the requests with an N+1 or a failed statement.
The route pattern appears under the literal path, so you can see at a glance
that /orders/17094 was served by /orders/{order_id}.
Request detail
The page that earns the library its keep.
- Six tiles: status, total time, time in SQL, time in Python, query count, duplicate count.
- A banner when statements repeated, because that is the signature of an N+1.
- Every statement, grouped by SQL text. A group that ran more than once is highlighted and badged with its count.
- A stack per group, naming the frames in your code that issued it — with library frames (SQLAlchemy, anyio, asyncio, greenlet, the profiler itself) filtered out.
When the same SQL is issued from more than one place, the page says so rather than implying the single stack explains every execution.
Summary
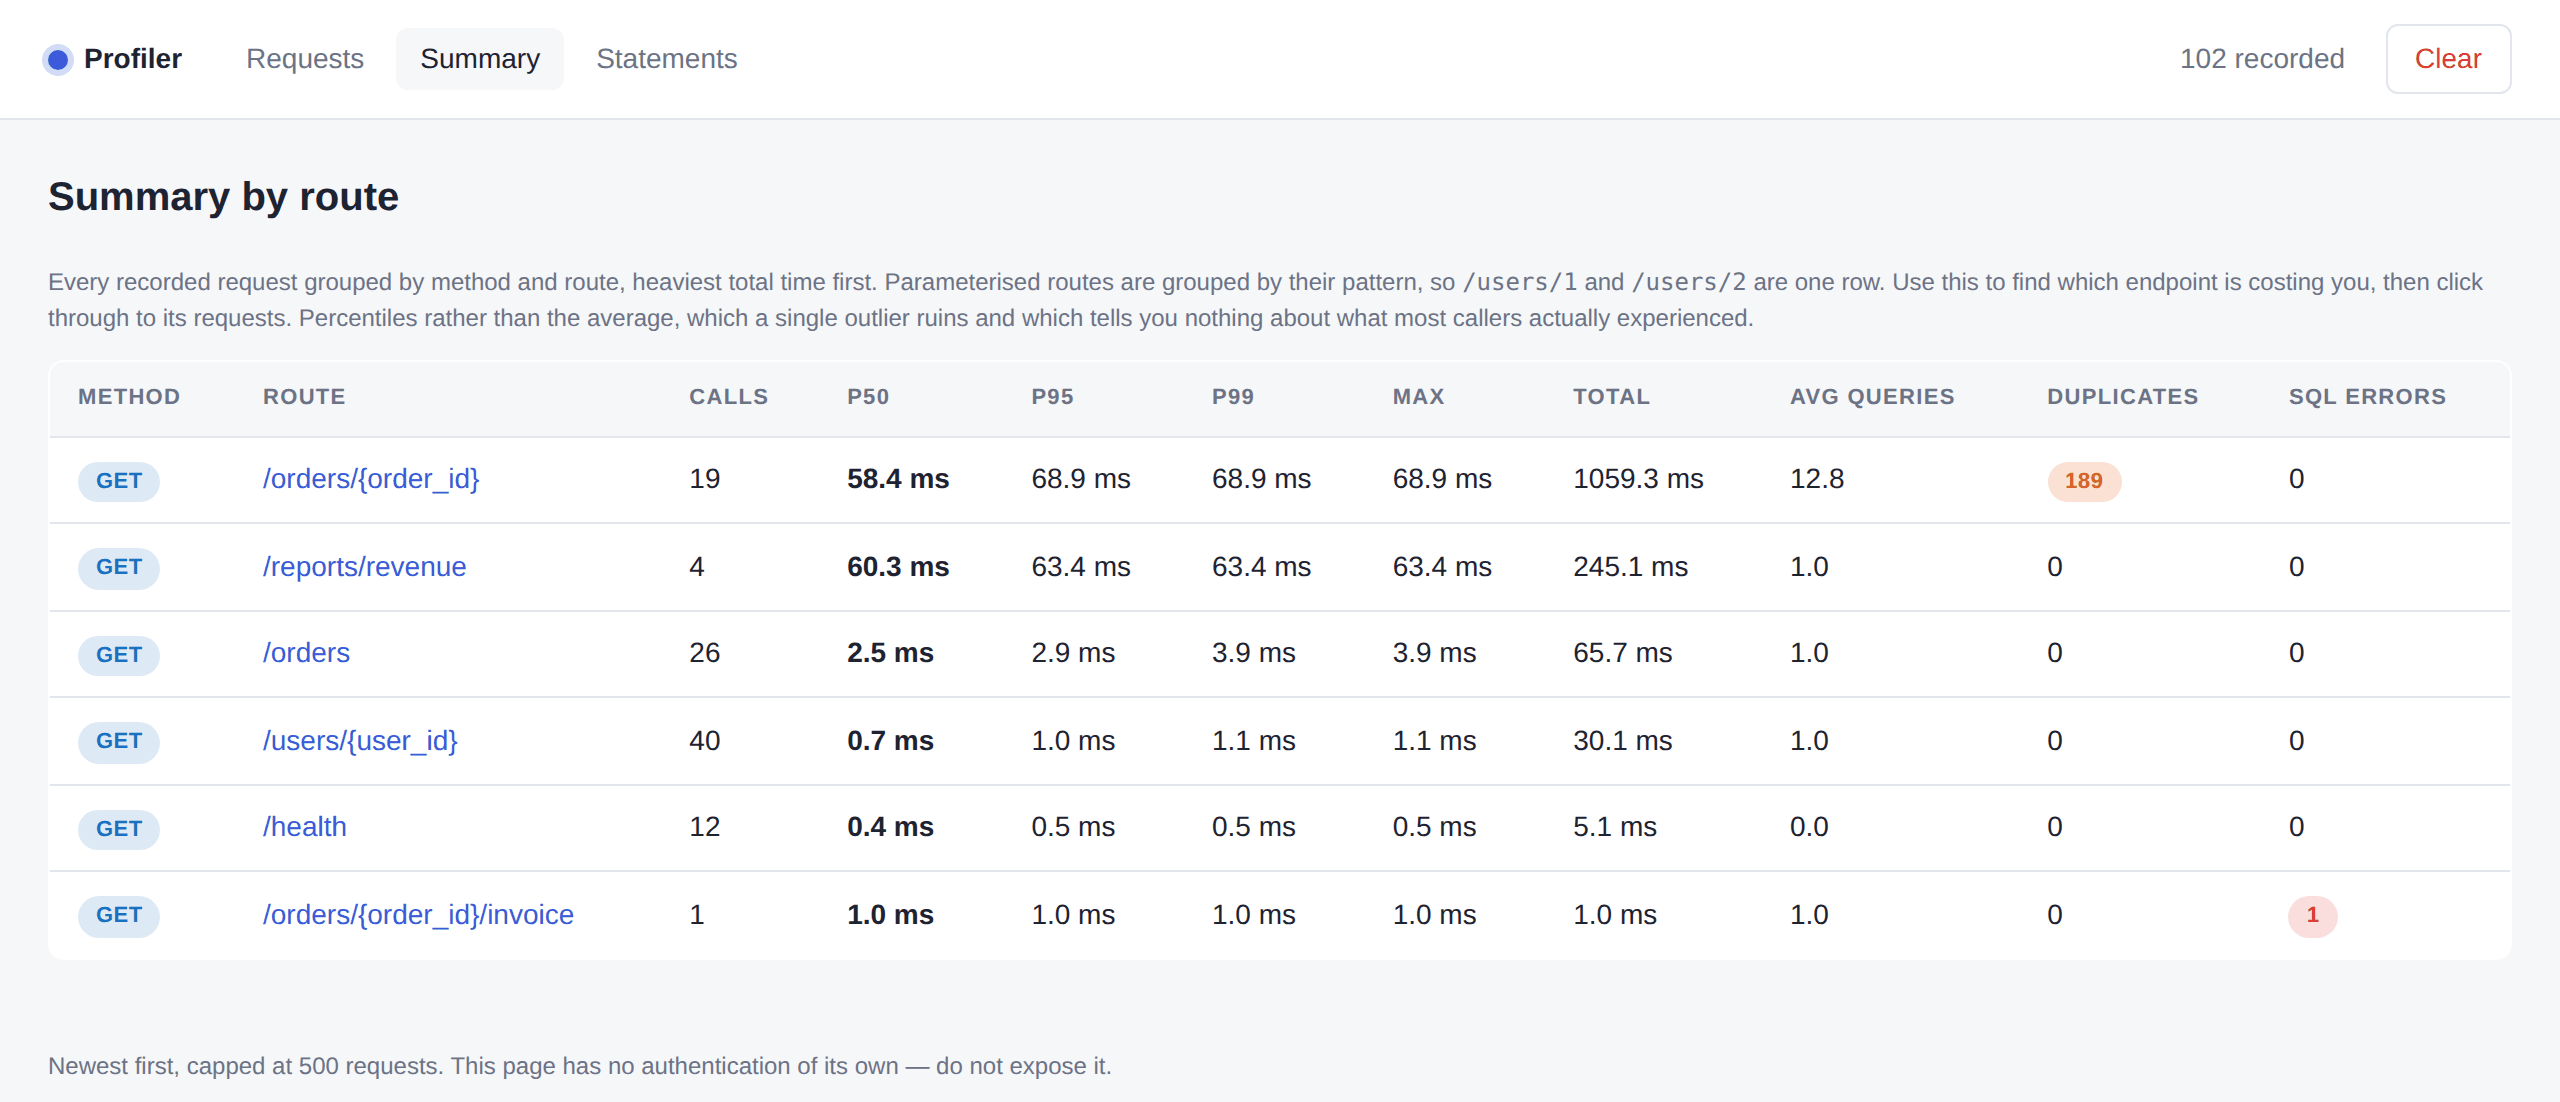
Every request grouped by method and route pattern, heaviest total time first.
Percentiles — p50, p95, p99 — rather than the average, which one outlier ruins and which tells you nothing about what most callers actually experienced.
Statements
The same statements aggregated across all requests, so a query that is only slightly slow but runs on every endpoint surfaces next to the one dramatic query on a single page.